Accessing the local log files.
When a school or business adopts remote management and mobility something becomes immediately obvious - it’s often no longer possible to access a local machine to troubleshoot an issue.
The device could be at home, offline or just turned off. The user may not have the elevated privileges to run diagnostics, have concerns about remote sessions or be unable to securely transfer clear text log files over the internet. Suddenly support is a different world.
The Intune (MEM) console has a range of reporting tools that can provide insights into failed operations and these are a great place to start but sometimes you need to get hold of the local logs to get the complete picture.
On the client side Microsoft provides some excellent tools that can collate information into easily readable files. The most useful of these is MDMDiagHtmlReport.html. This can be generated by visiting navigating to Settings - Accounts - Access work or school. Find the Connected to “Your Organisation” banner and click the Info button.
The Info dialog is divided into three sections. In the last section you have the option to produce an Advanced Diagnostic Report by clicking “Create Report”.
This action builds the MDMDiagHtmlReport html file in the C:\users\public\documents\MDMDiagnostics directory which contains information on the devices status and the policy settings being applied.
Alternatively you can select the Export your management log file link that is listed below the Connected to “Your Organisation” banner. This option goes a little bit further and creates a cab file in the same directory that contains both the MDMDiagHtmlReport file and a host of other diagnostics files including dumps of key event logs.
However useful these resources are the problem still remains that they are stored on the users computer and are not directly accessible to the support team
However a new MEM feature currently in public preview changes all of that.
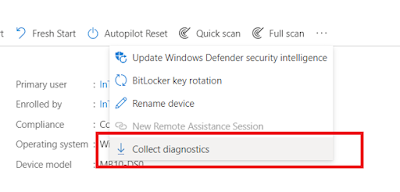
If you navigate to the Devices - Window section in the MEM console and select a device, expanding the ellipses (…) should reveal a new option - Collect diagnostics.
Selecting it will present a dialog asking you whether to collect diagnostics from the device. A simple click on the YES button starts the process.
The results can be found in Monitor - Device Diagnostics on the same device pane (below).
Initially the status will show pending but once the device picks up the request you should see the status update to Complete with the option to Download. If the device is online the action takes about ten minutes.
The process creates a zip file which you might expect to contain a set of files but instead it presents a list of directories numbered 1-50.
Since the feature is still in preview these directories might be renamed to give a better idea of the contents but at the moment it’s a bit like opening your birthday presents. A number of the directories contain a single file which is nothing more than a log of the process that created the rest of the logs (logs of logs) but some are much more useful.
All this could change but at the moment some of the highlights are listed below.
Spoiler Alert: the MDMDiagHtmlReport can be found in a cab file in directory 44.
- Directory 1 -11
Dumps of registry entries (.reg).
- Directory 12 -27
Logs files for the collection actions (logs of logs)
- Directory 28 -37
Dumps of various Event logs. (.evt)
- Directory 38:
A set of event traces data files relating to Autopilot. To view an etl file open with PerfView.exe.
- Directory 40
Contains mpsupportfiles, a cab file that contains various diagnostic logs and event dumps relating to Windows Defender.
- Directory 41:
The wlan-report-latest html report created by the ‘netsh wlan show wlanreport’ command that shows wireless session information and related stats.
Apart from a wealth of information in the hardware interfaces it contains a dump of the output from 'ipconfig /all' and ‘netsh wlan show’ - two of the most useful tools in the box.
- Directory 43:
The energy-report.html output file created by powercfg /batteryreport tool useful in troubleshooting laptop battery usage and health.
- Directory 44:
Holds a single file mdmlogs-xxxxxxxx.cab which contains the files created by the Export your management log file link including the important MDMDiagHtmlReport file.
Other files include:
DeviceHash_<devicename>.csv - contains the device hash.
Setupact.log - Information and log events from upgrade actions.
Intune Management Extension logs.
- AgentExecutor.log
- ClientHealth.log
- IntuneManagementExtension-xxxx.log
Event logs from key MDM providers.
- Directory 45:
Log file output from the msinfo32.exe tool which summarized the hardware and software profile of the device.
- Directory 48:
Cbs.log : Component-Based Servicing Log. This file contains detailed information from the most recent Windows installed updates.
Hopefully the directory set will be updated to make navigation through the file a bit easier. However even in the preview phase this is a welcome addition to the troubleshooting toolkit.


